![]()
If you are using Zabbix centralized monitoring server and want to monitor your all host MySQL then you should follow below steps. This is really an easy job.
First of all, go to your Zabbix configuration folder, that is /etc/zabbix.
# cd /etc/zabbix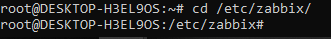
create a file in this directory named “.my.cnf” (without the colon)
# touch .my.cnf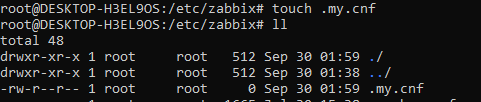
open the .my.cnf file with your preference editor. (In my case I am opening with vim editor)
# vim .my.cnf
Paste the following lines and give your MySQL credential here (I recommended that put your MySQL root credential in this file)
[mysql]
user=root
password=123
[mysqladmin]
user=root
password=123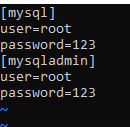
Save and exit the file
Then, go to the “/etc/zabbix/zabbix_agentd.d” directory
cd /etc/zabbix/zabbix_agentd.dEmpty the userparameter_mysql.conf file
>userparameter_mysql.confPaste the following lines to the userparameter_mysql.conf file
# For all the following commands HOME should be set to the directory that has .my.cnf file with password information.

# Flexible parameter to grab global variables. On the frontend side, use keys like mysql.status[Com_insert].
# Key syntax is mysql.status[variable].
UserParameter=mysql.status[*],echo "show global status where Variable_name='$1';" | HOME=/etc/zabbix mysql -N | awk '{print $$2}'

# Flexible parameter to determine database or table size. On the frontend side, use keys like mysql.size[zabbix,history,data].
# Key syntax is mysql.size[<database>,<table>,<type>].
# Database may be a database name or "all". Default is "all".
# Table may be a table name or "all". Default is "all".
# Type may be "data", "index", "free" or "both". Both is a sum of data and index. Default is "both".
# Database is mandatory if a table is specified. Type may be specified always.
# Returns value in bytes.
# 'sum' on data_length or index_length alone needed when we are getting this information for whole database instead of a single table
UserParameter=mysql.size[*],echo "select sum($(case "$3" in both|"") echo "data_length+index_length";; data|index) echo "$3_length";; free) echo "data_free";; esac)) from information_schema.tables$([[ "$1" = "all" || ! "$1" ]] || echo " where table_schema='$1'")$([[ "$2" = "all" || ! "$2" ]] || echo "and table_name='$2'");" | HOME=/etc/zabbix mysql -N

UserParameter=mysql.ping,HOME=/etc/zabbix mysqladmin ping | grep -c alive
UserParameter=mysql.version,mysql -V
Save and close the file
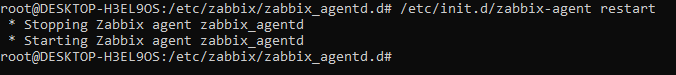
Restart the zabbix-agent service
You have done the zabbix-agent part
Now open the Zabbix dashboard and select the host which you just have configured the
Go to the “Template” TAB –> select “Template DB MySQL” (this is a default Zabbix template) –>
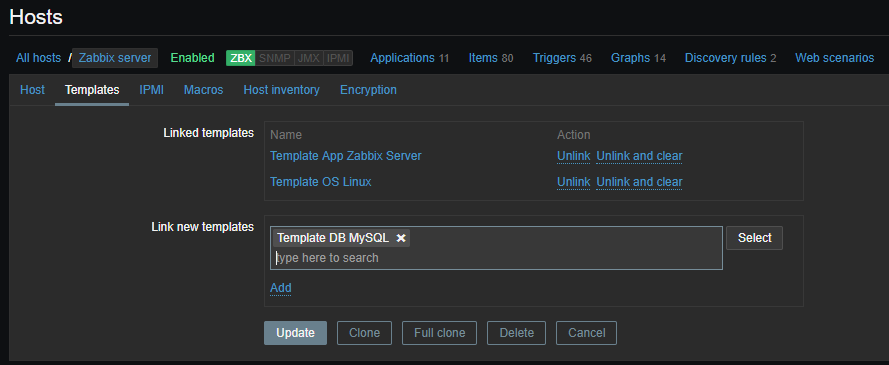
Click Add button
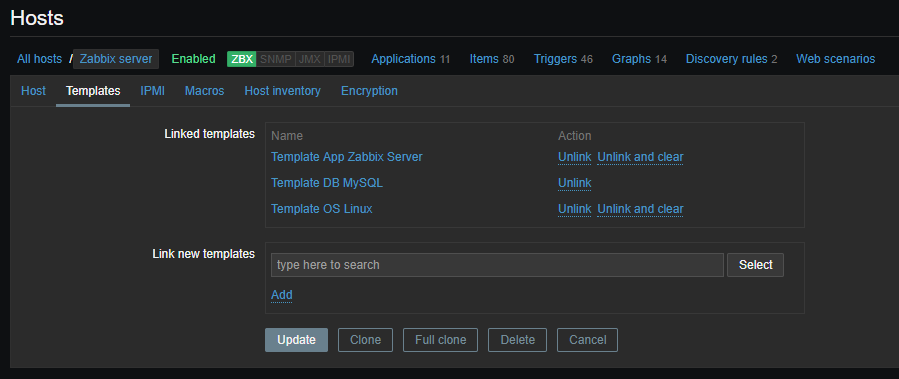
Click on update

You are all done!! Now wait couple of minutes you will get all the MySQL/MariaDB data to your Zabbix server.
Please contact with me if you face any problem regarding this.
I get this this error message :
ERROR 1045 (28000): Access denied for user ‘zabbix’@’localhost’ (using password: NO)
The Zabbix cann’t get data from remote mysql. Could you please help me fix this issues.
Hi there,
Sorry for my late response. As per your comment this is not a typical zabbix error. Basically this error “ERROR 1045 (28000)” related to your mysql user and password, so please check the below points once.
1) Check your mysql username that you are using
2) Reset your mysql user password
3) Update your userparameter_mysql.conf file.
I think this will solved your problem and if not please comment me.