![]()
Zabbix server gives you bandwidth calculation via “net.if.in[eth0,bytes]” and “net.if.out[eth0,bytes]” functions. But sometime you might face some issue with this functions, e.g. sometime might be your actual bandwidth data mismatch with the Zabbix server shown data. So, for the mitigate this problem you can use this solution. If you face any issue regarding this please comment on these post.
Please find the related video for this.
Here I am using vnstat tool for the collecting of all bandwidth data from agent servers.
Dependency Package (Ubuntu, CentOS):
- vnstat
- bc
- zip, unzip
- dos2unix
This Tutorial gives you
- Total Outbound for today
- Total OutBound For Current Hour
- Total Inbound for today
- Total Inbound For Current Hour
- Total Bandwidth For Previous Hour
- Total Bandwidth For Current Hour
- Total Bandwidth for Today
- Total Bandwidth for last 7 days
- Total Bandwidth for the current Month
- Last 2 month bandwidth (current+previous)
In Agent server (Login to the agent server SSH)
First Install all package along with the dependencies.
# apt-get install vnstat bc unzip zip dos2unix -ySetup the vnstat interface and create interface database for vnstat. Edit below code () with your server network interface.
# vnstat -u -i $interfaceNow create a directory for Bandwidth calculation script and go to the directory.
# mkdir /etc/zabbix/script
# cd /etc/zabbix/script
Download the below link and unzip the file.
# wget https://www.try2answer.com/wp-content/uploads/2018/10/bandwidth.zip
# unzip bandwidth.zip
Give the executive permission to the all script files
# chmod +x *Add below cron for automatic Bandwidth Update.
echo "*/5 * * * * sh /etc/zabbix/script/update.sh"to removing all hidden windows characters from script files
# dos2unix *.shAdd UserParameter to the zabbix agent conf file
# echo "UserParameter=system.monthlybandwidth,/etc/zabbix/script/zabbix_total_month_bandwidth.sh
UserParameter=system.todaybandwidth,/etc/zabbix/script/zabbix_todays_total_bandwidth.sh
UserParameter=system.todayinbound,/etc/zabbix/script/zabbix_todays_total_inbound.sh
UserParameter=system.todayoutbound,/etc/zabbix/script/zabbix_todays_total_outbound.sh
UserParameter=system.last7daybandwidth,/etc/zabbix/script/zabbix_last_7_days_total_bandwidth.sh
UserParameter=system.currenthour,/etc/zabbix/script/total_bandwidth_for_current_hour.sh
UserParameter=system.previoushour,/etc/zabbix/script/total_bandwidth_for_previous_hour.sh
UserParameter=system.last2month,/etc/zabbix/script/last_2_month_total_bandwidth.sh
UserParameter=system.currenthourin,/etc/zabbix/script/total_inbound_for_current_hour.sh
UserParameter=system.currenthourout,/etc/zabbix/script/total_outbound_for_current_hour.sh" >> /etc/zabbix/zabbix_agentd.conf
Restart the zabbix agent
For Ubuntu
# /etc/init.d/zabbix-agent restart
For CentOS
# systemctl restart zabbix-agent
Check once the zabbix agent server is running or not.
# netstat -tlnp | grep zabbixYou have done in the Zabbix agent Part, Now login to the zabbix server Dashboard.
In Zabbix Server (Login to the Zabbix server Dashboard)
Download the below Template and unzip
After unzip, Login to the zabbix Dashboard –> Configuration –> Templates –> Click on Import –> Select the xml template file –> Click on Import

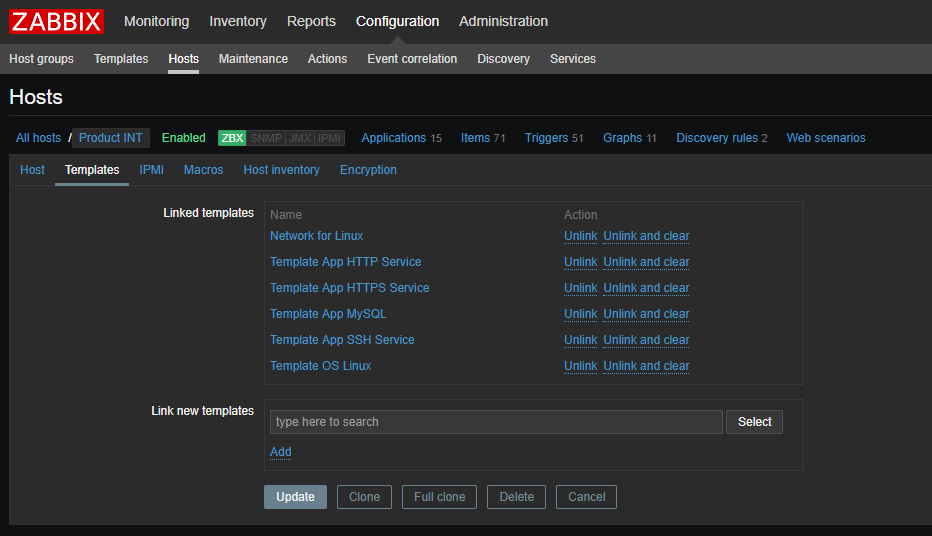
After the template successfully add to the zabbix server, select the host server and attach the newly added template.
dashboard –> Configuration –> Hosts –> Select Host –> Template Tab –> Link New template –> Add –> Update.
After Update the host, Wait some time we will get all Bandwidth Calculation report.
You are all Done!
Extra Data from This tutorials
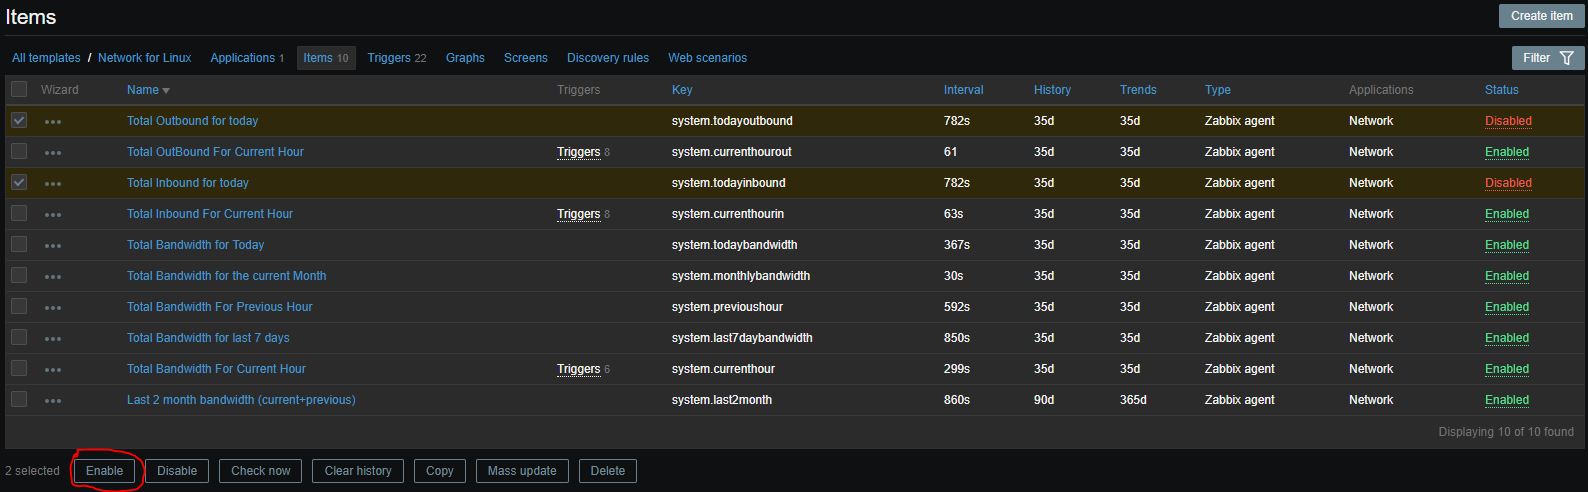
By Default Below two items are disabled and you will not get below two data.
- Total Outbound for today
- Total Inbound for today
But If you want to see this data, you can enable it anytime from your zabbix dashboard.
Dashboard –> Configuration –> Templates –> Network for Linux –> Items –> Check 2 Item that are disabled –> Click on Enable.
If You face any issue regarding this please comment below:
Thank You
Great! Nawab!
Last 2 month bandwidth (current+previous) 2019-09-09 12:11:37 (standard_in) 1: syntax error
Hello Den,
Sorry for the late response!
Actually all the script is completely depend on the vnstat output format. Output format of vnstat will be differed on the each Linux distribution (Ubuntu, Centos). So in that case can you please provide the output of below commands. so that I can check from my end and update the script respectively.
# vnstat –oneline
# vnstat –m
Also, as all the script are written in windows system, so it is recommended that please run dos2unix command before using all the script.
Thanks
Shubhankar
I do above configuration in centos server( zabbix client) and in zabiix server showing wrong data, wt to do
Hello Parthiban,
Sorry for late reply, is your vnstat is showing correct data by command line? are all data (Monthly, daily, Hourly) showing the same thing. If yes please send me the screen shot in my email address. I will like to resolve the issue.
Thanks
Shubhankar
Hi,
i am using zabbix server 3.4, i tried to importe *xml template but it is no compatible.
do you know if there is a *xml for 3.4 version?
Rgs
Alexander
Hello Alexander,
Yes, zabbix 3.4 is supported for xml file as a template.
I do above configuration in centos server( zabbix client) and in zabiix server showing wrong data, wt to do
All the script is completely depend on the vnstat output format. Output format of vnstat will be differed on the each Linux distribution (Ubuntu, Centos). So in that case can you please provide the output of below commands. so that I can check from my end and update the script respectively.
# vnstat –oneline
# vnstat –m
Also, as all the script are written in windows system, so it is recommended that please run dos2unix command before using all the script.
Thanks
Shubhankar
I am trying to Monitor Daily, Weekly and Monthly Bandwidth Usage of 200 + Local and Remote Workstations / Laptops with Zabbix
I also need the Bandwidth Usage to be Emailed
How can i do this in Zabbix?
Any help greatly appreciated
Hello,
Yes, it can be easily possible via the zabbix. Please follow the tutorial, this is very easy, I think if you follow every steps, you will resolve your issue.
For sending email, please use a proper SMTP server to send the mail from zabibx and create trigger as you want.
If anything else you need help from me, kindly email me with your queries to my email, I will surely answer them.
Thanks
Shubhankar
Hey Shubhankar,
nice tutorial – I’m trying to debug the script as I probably have a different vnstat version then your, meaning when I run the script manually it outpout a blank data,
here is the outpost of vnstat -m
#$ vnstat -m
eth0 / monthly
month rx | tx | total | avg. rate
————————+————-+————-+—————
2020-08 16.81 MiB | 10.67 MiB | 27.48 MiB | 245 bit/s
————————+————-+————-+—————
estimated 45.98 MiB | 28.10 MiB | 74.08 MiB |
the script not working are currently the one with the hour, – here is the output of vnstat -h
#$
eth0 / hourly
hour rx | tx | total | avg. rate
————————+————-+————-+—————
2020-08-11
15:00 939.69 KiB | 1.02 MiB | 1.94 MiB | 4.51 kbit/s
16:00 2.13 MiB | 3.74 MiB | 5.87 MiB | 13.69 kbit/s
17:00 2.42 MiB | 1.11 MiB | 3.54 MiB | 8.24 kbit/s
18:00 2.90 MiB | 1.05 MiB | 3.95 MiB | 9.21 kbit/s
19:00 3.14 MiB | 1.34 MiB | 4.47 MiB | 10.43 kbit/s
20:00 4.65 MiB | 2.04 MiB | 6.69 MiB | 15.59 kbit/s
21:00 979.88 KiB | 725.79 KiB | 1.67 MiB | 15.53 kbit/s
————————+————-+————-+—————
I’m sure that an issue with the awk but I’m not sure the logic behind tempin1 and tempin2
thanks!
Hello
Zabbix 5.0
After import the xml file Network-For-Linux.xml and get import successfully,
I can’t find the items under the network in the Monitoring \ latest data
Thanks
Avi
ok I find that I need to mark the Show items without data.
so I need help to find the reason that I don’t get values
hello
I installed in zabbix agent release_5.0-1
run # vnstat
and get Database updated: Sun Sep 27 16:02:49 2020
run # vnstat –live
and get Monitoring eth0…and see the numbers
but in the zabbix server 5.0 I don’t get the values and the last check is empty
Where to check why the data does not reach from the zabbix agent to the zabbix server
Thanks
Avi
Hi.
Thank you very much for this.
The following 3 scripts were showing errors:
total_bandwidth_for_current_hour.sh
total_inbound_for_current_hour.sh
total_outbound_for_current_hour.sh
total_bandwidth_for_previous_hour.sh
(standard_in) 1: syntax error
The problem was that in awk you were printing 10 / 11 column, however in vnstat only 9 exists. So I simply replaced 10 with 8 and 11 with 9 and everything is working.
Have a nice day!
Thanks for your comment
Hi, I am unable to get information on windows networks’ bandwidth details. My contact number is 9591019145. Could you please call me?
Thanks
Hi @try2answer,
I was using Whatsup Gold, so I want to export into Excel of links device up and down time in zabbix. Can u suggest me for this.
And one more thing
Hi,
I am using cento7 and getting sytax error while executing script.
the output of vnstat –oneline is
vnstat –oneline
1;ens32;09/21/2022;4.20 MiB;4.07 MiB;8.27 MiB;2.50 kbit/s;Sep ’22;4.20 MiB;4.07 MiB;8.27 MiB;0.04 kbit/s;4.20 MiB;4.07 MiB;8.27 MiB
the output of vnstat -m
ens32 / monthly
month rx | tx | total | avg. rate
————————+————-+————-+—————
Sep ’22 4.20 MiB | 4.07 MiB | 8.27 MiB | 0.04 kbit/s
————————+————-+————-+—————
estimated 5 MiB | 5 MiB | 10 MiB |
[root@nl5 bwmonitor]#
please suggest me what i need to modify in script.
Hello Sohaib,
All the script is completely depend on the vnstat output format. Output format of vnstat will be differed on the each Linux distribution (Ubuntu, Centos). So in that case can you please provide the output of below commands. so that I can check from my end and update the script respectively.
# vnstat –oneline
# vnstat –m
Also, as all the script are written in windows system, so it is recommended that please run dos2unix command before using all the script.
Thanks
Shubhankar
hello I am facing an issue with total_bandwidth_for_current_hour.sh value output is string instead on float
root@host:/etc/zabbix/script# vnstat –oneline
1;eth0;2024-04-30;44.82 MiB;74.30 MiB;119.13 MiB;43.40 kbit/s;2024-04;44.82 MiB;74.30 MiB;119.13 MiB;43.40 kbit/s;44.82 MiB;74.30 MiB;119.13 MiB
root@host:/etc/zabbix/script# vnstat -h
eth0 / hourly
hour rx | tx | total | avg. rate
————————+————-+————-+—————
2024-04-30
11:00 4.66 MiB | 8.23 MiB | 12.89 MiB | 30.02 kbit/s
12:00 6.52 MiB | 10.13 MiB | 16.65 MiB | 38.80 kbit/s
13:00 7.71 MiB | 16.90 MiB | 24.61 MiB | 57.35 kbit/s
14:00 6.81 MiB | 10.03 MiB | 16.83 MiB | 39.23 kbit/s
15:00 7.08 MiB | 10.80 MiB | 17.88 MiB | 41.65 kbit/s
16:00 7.19 MiB | 11.16 MiB | 18.35 MiB | 42.76 kbit/s
17:00 4.86 MiB | 7.06 MiB | 11.92 MiB | 41.65 kbit/s
————————+————-+————-+—————